Set Theory: Beyond the Elements
Section outline
-
-
👋 Welcome to the Grade 11 Set Theory Course!
-
-
🎯 Objective: Understand and recall basic set operations and Venn diagrams.
-
-
In simple terms, a Venn diagram is a visual way to show how sets (groups of things) overlap or don’t overlap. Each circle represents a set. If the circles overlap, it means the sets share some elements.
✨ To refresh your memory from Grade 10, watch the video below!
-
-
-
🎯 Objective:
By the end of this lesson, you will learn how to solve problems involving three sets using Venn diagrams. You’ll explore how to label regions, find unknown values, and use set operations like union, intersection, and complement in more complex scenarios.A 3-set Venn diagram is a visual tool used to represent relationships between three different sets. It consists of three overlapping circles, where:
-
Each circle represents a different set (e.g., A, B, and C).
-
The overlapping regions between the circles show elements that are shared between the sets.
-
The central area where all three circles overlap represents elements that belong to all three sets.
-
The space outside all circles represents the universal set — everything else not included in A, B, or C.

Watch the video below to get a visual intro to three-set Venn diagrams with a simple example.
-
Opened: Sunday, 18 May 2025, 12:00 AMDue: Thursday, 25 September 2025, 12:00 AM
-
-
Now that you’ve got the basics of 3-set Venn diagrams down, let’s see how they’re actually used to solve real-world problems. The next video will walk you through some examples.
👉 Make sure to try the questions with the teacher as they’re explained — don’t just watch passively! That’s the best way to really understand how it works.
You can see the following example to understand better about this.
The following Venn diagram provides information on the types of crops that a group of farmers cultivate. Describe each of the subsets which are denoted by the capital letters as well as the subsets denoted by the following composite regions.
(i) B and C
(ii) C and D
(iii) A and D and E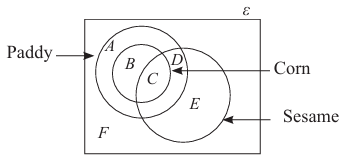
A – Farmers who cultivate only paddy
B – Farmers who cultivate only paddy and corn
C – Farmers who cultivate paddy, corn and sesame
D – Farmers who cultivate paddy and sesame but not corn
E – Farmers who cultivate only sesame
F – Farmers who do not cultivate any of these three crops
B and C – Farmers who cultivate corn
C and D – Farmers who cultivate paddy and sesame
A and D and E –Farmers who cultivate at least one crop but do not cultivate cornThis example shows how Venn diagrams help us visualize real-world data 🌍, such as crop cultivation, and see where different groups or categories overlap. By using these intersections, we can make informed decisions about crop distribution or resource allocation. 📊
After exploring these questions, you'll gain a better understanding of how Venn diagrams solve complex problems involving multiple categories or conditions 🔍💡.
-
Opened: Sunday, 18 May 2025, 12:00 AMDue: Thursday, 25 September 2025, 12:00 AM
-
Opened: Sunday, 18 May 2025, 12:00 AMDue: Thursday, 25 September 2025, 12:00 AM
-
🎉 You’ve made it to the final lesson of this course module! 🎉
🎯Objective:
By the end of this lesson, you’ll be able to solve multi-step problems that integrate sets with other mathematical concepts, such as probability and algebra. You’ll use the skills you’ve learned in previous lessons to tackle more complex problems involving multiple sets.
Now that you’re familiar with all the basic and intermediate concepts, it’s time to level up and dive deeper into more advanced topics.
In this video, we’ll explore multi-step problems that combine sets with other mathematical concepts like probability.
Consider the following example to freshen things up 😉.
From a group of 120 students, 41 learn agriculture, 47 learn music and 42 learn health science. 14 students learn agriculture and music, 19 learn music and health science, 25 learn agriculture and health science and 8 learn all three subjects. Represent this information in a Venn diagram and thereby determine the following.
(i) The number of students who learn only agriculture
(ii) The number of students who learn only one of these subjects
(iii) The number of students who learn at least two of these subjects
(iv) The number of students who do not learn any one of these three subjects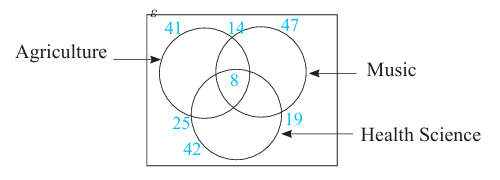
Let us find the number of elements in the remaining regions using the given information.
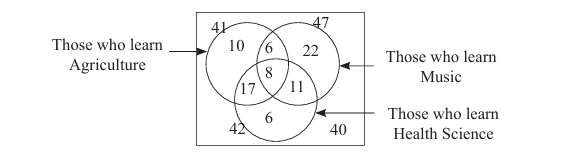
(i) 10
(ii) 10 + 22 + 6 = 38
(iii) 17 + 6 + 11 + 8 = 42
(iv) 40-
-
In this activity, you'll break out into small groups and work together to solve a set problem. Everyone in your group will bring their ideas to the table, and by combining your skills, you'll crack the problem in no time!
-
-
-