Real World Application of Sets
Section outline
-
Now that you’ve got the basics of 3-set Venn diagrams down, let’s see how they’re actually used to solve real-world problems. The next video will walk you through some examples.
👉 Make sure to try the questions with the teacher as they’re explained — don’t just watch passively! That’s the best way to really understand how it works.
You can see the following example to understand better about this.
The following Venn diagram provides information on the types of crops that a group of farmers cultivate. Describe each of the subsets which are denoted by the capital letters as well as the subsets denoted by the following composite regions.
(i) B and C
(ii) C and D
(iii) A and D and E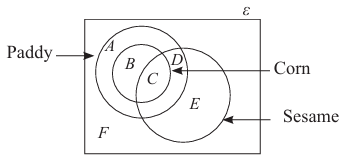
A – Farmers who cultivate only paddy
B – Farmers who cultivate only paddy and corn
C – Farmers who cultivate paddy, corn and sesame
D – Farmers who cultivate paddy and sesame but not corn
E – Farmers who cultivate only sesame
F – Farmers who do not cultivate any of these three crops
B and C – Farmers who cultivate corn
C and D – Farmers who cultivate paddy and sesame
A and D and E –Farmers who cultivate at least one crop but do not cultivate cornThis example shows how Venn diagrams help us visualize real-world data 🌍, such as crop cultivation, and see where different groups or categories overlap. By using these intersections, we can make informed decisions about crop distribution or resource allocation. 📊
After exploring these questions, you'll gain a better understanding of how Venn diagrams solve complex problems involving multiple categories or conditions 🔍💡.
-
Opened: Sunday, 18 May 2025, 12:00 AMDue: Thursday, 25 September 2025, 12:00 AM
-
Opened: Sunday, 18 May 2025, 12:00 AMDue: Thursday, 25 September 2025, 12:00 AM